The RewirEd System Map
What if there was a way to map both the challenges and opportunities in education - so as to ask ourselves better questions and unearth new thinking in education?
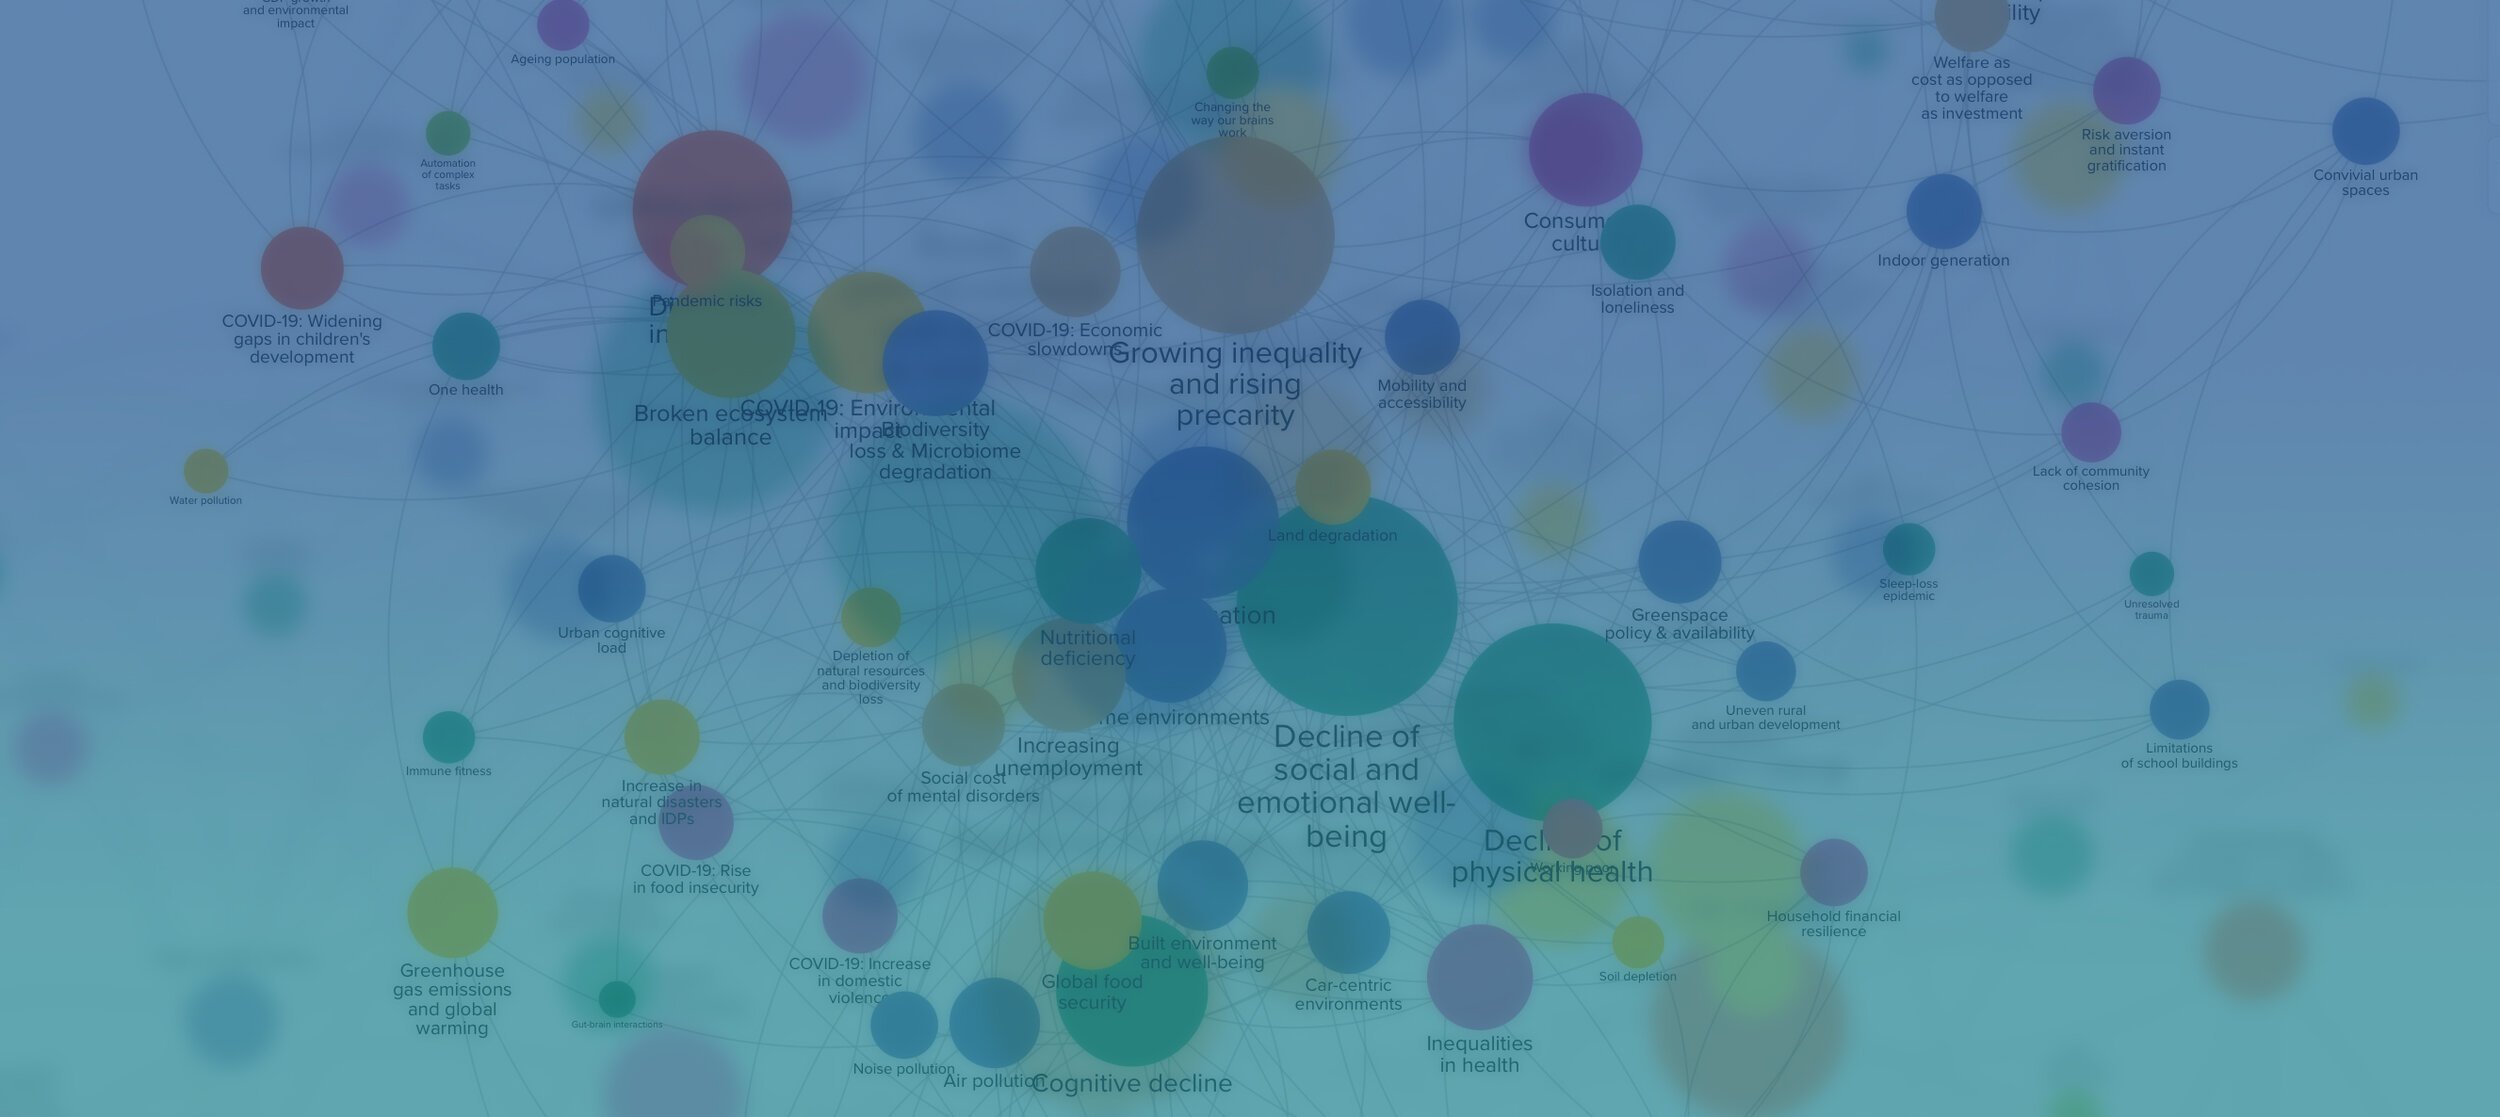
Developed over a nearly 12 month period based on exploration and consultations with diverse stakeholders from within and beyond the education sector, the RewirEd Systems Mapis an open-source attempt for visualizing and navigating the complexity and interdependencies in and around education.
To develop the system map Radicle engaged more than 100 stakeholders through interviews and co-hosted group sessions with leaders, innovators, and organizations across disciplines and sectors. The system map both demonstrates and highlights the drivers, failures, opportunities, and trends emerging in the increasingly complex education system.
The map allows one to go beyond the usual surface-level issues and identify the root causes that often get ignored or sidelined. We hope the data from this map will be helpful and guide the user to new ways to collectively add together, unearth new thinking in education and build a sustainable future for us all.
There are multiple ways to explore the digital system map. This presentation will guide you through the various layers of the map, step by step, as well as giving you a glimpse of how the map was made. Click hereto see the presentation in a new window.
7 Crisis narratives
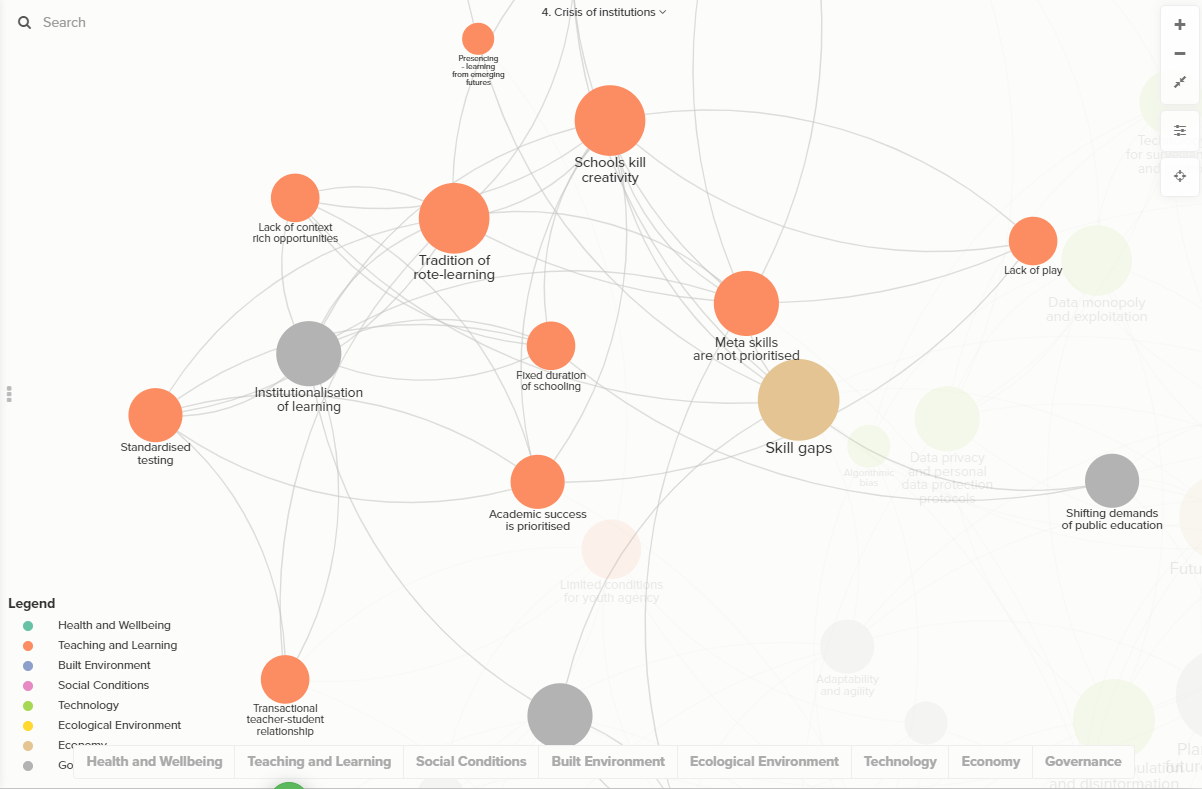
Through research and the mapping process, we discovered patterns and clusters of interconnected issues affecting the education system as a whole. The 7 crisis narratives, ranging from health and well-being issues, our culture, environment, cities, institutions, economy, sense-making, and governance- helped communicate the diverse emerging challenges that impact human capabilities and potential today. Through the digital map, you can switch between the narratives to dive deeper into the issues that make up the clusters.
You can explore the map freely by yourself, by zooming in and out, and clicking on the circular nodes to read the descriptions of each problem. Click hereto see the map in a new window.